Overview
Capillary Flow Porometry
Through-pore Size Distribution
Capillary Flow Porometry (CFP) — also known as Gas Liquid Porometry (GLP) — is a fast, reliable method to determine the size and relative abundance of throughpores in sheets and membranes. This pressure-based technique measures the minimum diameter of a pore, averaging over a significant test area, without the need for model-fitting or image processing. Measurements are fast, sample preparation takes less than 30 seconds, and no mercury is involved.
- Sample Preparation
Sample is wetted with a special fluid that fills every pore.
- Wet Curve
Gas pressure is applied to force the wetting fluid from the pores. Larger pores open at lower pressure.
Increasing pressure opens more, smaller pores, increasing gas flow rate through the sample.
- Dry Curve
After all pores are opened and all of the wetting fluid has been expelled from the sample, flow across the
un-wetted dry film is measured.
Key Measurements
- Bubble Point, Largest Pore:
The lowest pressure at which flow occurs.
- Mean Flow Pore:
Intersection of the wet curve with the dry curve divided by two — the half-dry curve.
- Smallest Pore:
Intersection of the wet curve with the dry curve.
- Pore Size Distribution:
A continuous distribution of the differential and cumulative pore size reveals the overall structure of pores in a membrane.
Features
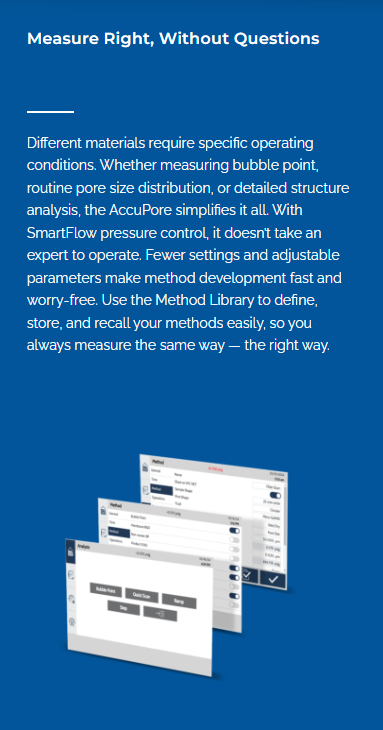
Exclusive Pressure Ramp And Step Capability
The SmartFlow system provides precision control for porosimetry in either pressure ramp or step modes. The option to perform measurements in either mode ensures the correct measurement is available from routine qualification to detailed characterization.
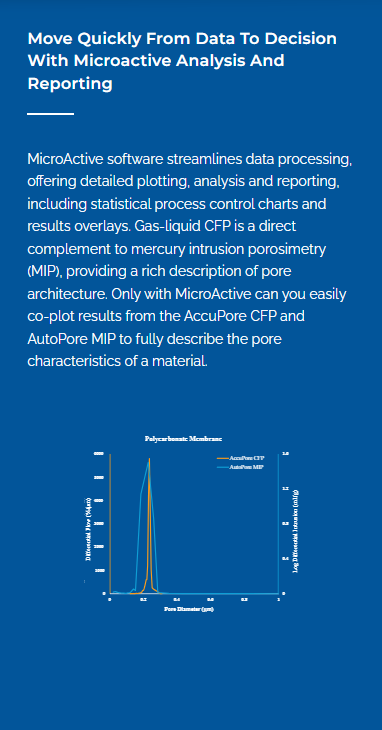
Detailed Pore Distribution Without Curve Fitting
High resolution, low noise pressure-flow curves enable highly detailed pore size distributions that reflect physical pore architecture WITHOUT curve fitting or post-processing.
Better Measurements With Smartflow
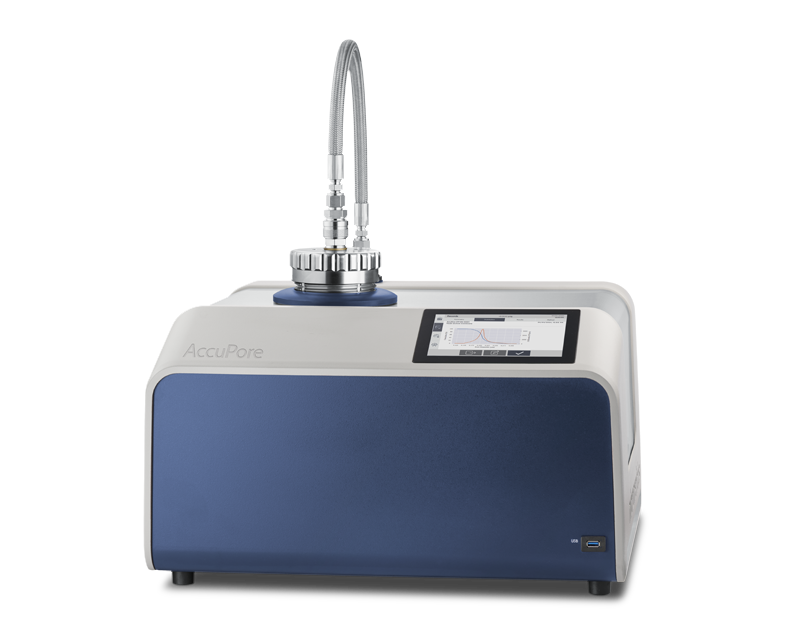
The AccuPore features SmartFlow, an advanced flow control system that guarantees the most precise pressure control, highest sensitivity, and lowest signal noise. High-resolution 24-bit electronics operated at 20 Hz for optimal signal quality and system response. With eight complementary transducers and controllers, SmartFlow delivers the most responsive and stable performance, even during rapidly changing conditions such as pore opening.
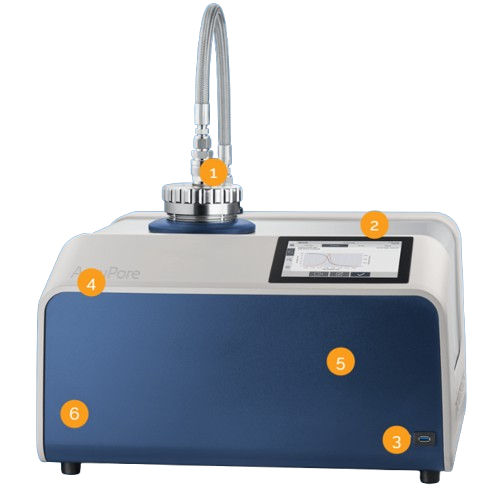
- Flexible easy-to-use sample chamber
for simple sample loading including samples from 13 mm to 47 mm diameter.
- Intuitive Breeze Interface
makes it easy to measure samples and review results with or without a PC.
- Convenient USB
access for data transfer or peripheral device integration. Even more ports at the back of the instrument.
- High-speed control, collection, and data processing
provides the most accurate pressure control, highest curve resolution, and most detailed pore size distribution by processing measurements at up to 20 Hz.
- MIC Net
empowers your lab to operate as one by synchronizing results and methods across AccuPore instruments. Laboratory network connection provides simple data retrieval and LIMS integration
- Auto-switching gas supply
reduces cost of operations be using low pressure
Why AccuPore?
The Most Accurate Bubble Point
SmartFlow also enables direct measurement of true bubble point through a proprietary flowcontrolled method that provides unmatched accuracy and repeatability. Conventional estimates of bubble point from pressure ramps lack sensitivity and can underestimate the largest pore diameter. SmartFlow ensures precise bubble point measurements, typically much better than ±1%.
| First Bubble Point Size (µm) |
| Measurement |
Track-etched
membrane A |
Track-etched
membrane B |
Track-etched
membrane C |
Track-etched
membrane D |
| 1 |
1.153 |
0.309 |
0.092 |
0.055 |
| 2 |
1.151 |
0.309 |
0.092 |
0.055 |
| 3 |
1.170 |
0.308 |
0.092 |
0.054 |
| 4 |
1.164 |
0.309 |
0.091 |
0.054 |
| 5 |
1.162 |
0.308 |
0.092 |
0.054 |
| 6 |
1.180 |
0.309 |
0.091 |
0.054 |
| 7 |
1.166 |
0.309 |
0.091 |
0.054 |
| 8 |
1.178 |
0.310 |
0.091 |
0.054 |
| 9 |
1.175 |
0.308 |
0.090 |
0.054 |
| 10 |
1.165 |
0.309 |
0.090 |
0.054 |
| Average |
1.166 |
0.309 |
0.091 |
0.054 |
| Relative standard deviation |
0.83% |
0.22% |
0.72% |
0.54% |
Run, Review, Report – At Your Fingertips
The intuitive Breeze touch interface gives you everything you need at your fingertips. Perform a measurement, review past results, send a report to print or to LIMS (PDF, text, or Excel) with the touch of a finger.
Save space in your lab by eliminating a PC from the bench.
Prefer to work from a PC nearby or in your office? You can do that too! Execute measurements, view status of multiple instruments, or review results…anywhere.
- Automatic results generation and retrieval:
- Largest pore diameter (bubble point)
- Mean pore diameter
- Smallest pore diameter
- Pore size distribution
- Tabular review of detailed test data
- Porometry and Pore Flow Distribution curve display
- Generate reports including print and export to file
- Export to file via network or USB
Applications
Battery And Fuel Cell Separators And Membranes
Optimize the rate of ion transport and physical separation to ensure device safety. Precision sample supports and advanced pressure control enable accurate measurements up to high pressure for small pores and thin membranes.
Filtration
Predict and ensure size-based selectivity and mass-transfer rate by optimizing the number and size of pores.
Non-wovens
Often characterized by a broad distribution of pore sizes due to their production methods. These are common choices for filtration media. In-plane porosity and irregular pore shapes make steady flow determination of bubble point especially important.
Metal And Ceramics
Preferred for thermal, physical, and chemical resistance, these materials often have highly porous structures. The three-dimensional porosity of these materials makes it especially important to measurement porosity in the direction of intended flow.